Blog

  • How Much Can You Make Day Trading With $25000?

    How Much Can You Make Day Trading With $25000?

    if you’re thinking about day trading with a $25,000 account, it’s helpful to have a clear picture of what’s possible and what to watch out for. Many traders aim to earn about 1% to 2% per day, which would be $250 to $500 daily on a $25,000 account. However, real-life results vary and often depend on your trading style, experience, and the overall market conditions. How much can you make day trading with $25000? Let’s discuss it in this article.

    Why Do You Need 25K to Day Trade?

    Why Do You Need 25K to Day Trade
    Why Do You Need 25K to Day Trade

    You need $25,000 to day trade because of the Pattern Day Trading (PDT) rule, a regulation created by FINRA to protect investors from taking on too much risk. According to this rule, if you have less than $25,000 in your margin account, you are limited in how many day trades you can make within a five-day period. By requiring this minimum balance, the rule aims to make sure traders have enough funds to handle potential losses and avoid risky trading behaviors that could lead to significant financial harm.

    Day Trading Rules Under 25K

    If your trading account balance is under $25,000, strict day trading rules apply due to the Pattern Day Trader (PDT) Rule. This rule states that you cannot make more than three day trades—buying and selling the same stock on the same day—within a rolling five-business-day period. If you exceed this limit, your account will be flagged, and your trading will be restricted, usually allowing you to only close positions or use limited leverage until you bring your account back above the $25,000 threshold. This pattern day trading 25k rule is designed to protect less-experienced traders from excessive risk and losses.

    Setting Realistic Expectations for a $25,000 Day Trading Account

    Realistic Expectations
    Realistic Expectations

    If you’re starting day trading with a $25,000 account, it’s important to set practical goals and understand the risks before jumping in. Some traders hope to make between $250 and $500 a day, which would be about a 1% to 2% return daily when things go well. However, most traders see annual profits closer to $5,000 to $12,500, since losses and inconsistent days are part of the process. In addition to focusing on profits, it’s wise to be aware of currency risk, as changing currency values can impact your trades even if your strategy seems sound.

    Success in day trading isn’t just about the numbers—it depends a lot on your mindset. Handling the pressure of rapid market changes and sticking to your plan even when emotions run high is key. Many people underestimate how much time and attention trading takes. You’ll need to spend hours each day watching the markets, studying price movements, and improving your approach. One way to build a strong foundation is by focusing on setting risk tolerance so you can control losses and avoid overexposing your account.

    The markets are unpredictable, so being able to adapt quickly makes a real difference. Learning never stops in trading. Even experienced traders keep refining their strategies and managing their risk to avoid big losses. For example, using stop-loss orders and only risking a small percentage of your account on each trade can help protect your money over time.

    A crucial part of day trading is risk management strategies, which can help you limit losses and protect your capital over the long term.

    Factors That Influence Day Trading Profits

    Many new traders get excited by the promise of quick profits, but your real results depend on several important factors working together. Market volatility is one of the biggest influences. When prices move quickly, there’s a chance to make more money in a short time. However, these swings can also lead to bigger losses if you’re on the wrong side of a trade. That’s why paying attention to how markets are behaving is so important. One crucial aspect to remember is the exchange rate risk, which can significantly affect your trades, especially in fast-moving markets.

    Trading psychology matters just as much as technical skills. Staying calm and making decisions without letting emotions take over can be the difference between building your account and wiping it out. For example, traders who panic during sudden drops often end up selling at the worst time, while those with a solid plan stick to their strategy. Understanding the impact of economic indicators on price movements can also help traders make more informed decisions and avoid emotional reactions to news events.

    Using borrowed funds, often called margin, can increase both your gains and your losses. For instance, on a $25,000 account, trading with margin lets you control larger positions, but it also means any mistake is much more costly. Many experienced traders set strict rules to control how much of their capital they risk on each trade.

    Your trading strategy also plays a direct role in your results. The best strategies are based on clear rules and are flexible enough to adjust when market conditions change. If you find that what worked last month isn’t working today, it may be time to review your approach.

    Finally, liquidity—how easy it is to buy or sell a stock—can impact your profits. Stocks with high trading volume make it easier to enter and exit trades quickly, often at prices close to what you expect. Low-liquidity stocks can be harder to trade and may cause you to miss out on profits or take bigger losses.

    It’s also vital not to ignore risk management, as failing to protect your capital during volatile markets can undermine your trading success.

    Smart Ways to Grow a $25,000 Day Trading Account

    Day trading can bring quick profits, but growing a $25,000 account takes more than just luck. A well-thought-out plan and strong self-control make a big difference. Focusing on stocks that move a lot during the day—often called high-volatility stocks—can give you more chances to earn in a short time. Paying attention to trading volume can help you spot when a stock has strong buying or selling interest, which can signal good opportunities for quick trades.

    Many traders use scalping, which means making several small trades to collect small gains that add up by the end of the session. Understanding how support and resistance influence price movement can help you time your entries and exits more effectively within each trading day.

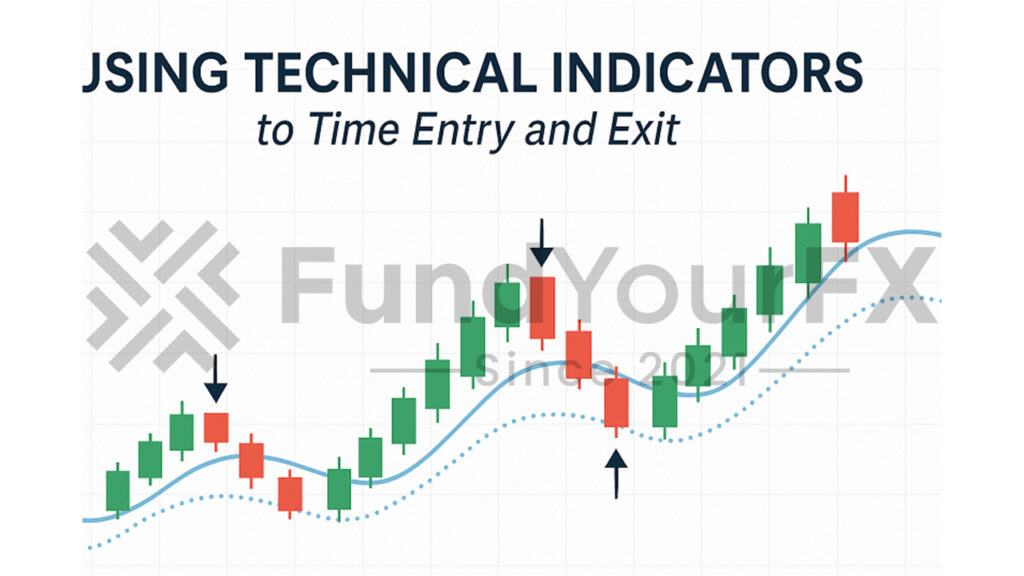
    Keep an eye on tools like moving averages and the Relative Strength Index (RSI) to help you decide when to buy and sell. These indicators show when a stock might be about to change direction or continue its current trend. Following the market’s direction, instead of fighting it, can improve your odds of success.

    Managing your emotions is just as important as choosing the right stock. Sticking to your original plan—even if the market gets unpredictable—helps prevent rash decisions that can lead to losses.

    It’s also helpful to review your trades each day. Writing down what worked and what didn’t can highlight patterns, helping you make better choices in the future.

    Adding technical analysis tools like Bollinger Bands can also help identify overbought or oversold conditions, giving you an edge in timing your trades.

    Managing Risk and Avoiding Significant Losses

    Growing a $25,000 day trading account takes more than just picking stocks that go up. Protecting your money is just as important as finding the next big winner. Many new traders focus on profits, but staying in the game means making sure you don’t lose too much in one bad streak. One of the best ways to do this is by using stop losses and careful position sizing.

    Why Stop Losses Matter

    Setting a stop loss on every trade means you decide in advance how much you’re willing to lose if the market moves against you. For example, if you never risk more than 2% of your account on a single trade, even a few losses in a row won’t wipe out your entire balance. This simple rule helps you avoid emotional decisions and protects your capital for future opportunities.

    Trade Sizing and Risk Per Trade

    Adjust how much you buy or sell based on your account size and how risky the trade is. If you have $25,000, risking $250–$500 on each trade (1–2%) is a common approach. This way, you’re not putting your whole account on the line just to chase a quick gain.

    Sticking to Your Plan

    It’s easy to let fear or excitement take over when trading. Following your plan, even during losing streaks, helps you avoid making snap decisions that can lead to bigger losses. Keep a trading journal to review your decisions and spot patterns that are working—or not.

    Key Steps for Managing Risk

    • Always use stop losses to limit potential losses.
    • Keep your position size in line with your risk tolerance.
    • Follow your trading plan to avoid emotional trades.

    Another important practice is to limit risk per trade to a small percentage of your trading capital, which is a proven way to preserve your account during volatile markets.

    Setting Realistic Expectations for Day Trading with a $25,000 Account

    Trading with a $25,000 account can seem like a good starting point, but it’s important to understand both the opportunities and the risks involved. Many new traders hope for daily profits, but the reality is that income from day trading is never guaranteed. The stock market can be unpredictable, and even experienced traders go through losing streaks.

    Most traders who are consistent and disciplined might aim for 1–2% profit per day, which would mean $250 to $500 daily. However, reaching these numbers requires a lot of skill, practice, and careful risk management. It’s common for traders to face setbacks, including losing more than 20% of their account during tougher periods.

    The truth is, trading success relies heavily on managing emotions and sticking to a well-tested strategy, especially when markets are volatile. Over the course of a month, steady traders might see returns between 5% and 10%. This level of consistency usually comes after months or even years of learning, adapting to market changes, and staying disciplined. It’s not just about making money—it’s about protecting your capital and learning from every trade, win or lose.

    Setting aside time for ongoing education and practice is just as important as having a good strategy. As one experienced trader put it:

    Additionally, understanding the importance of risk management is crucial, as it can be the difference between long-term success and significant financial losses.

    Example Trading Scenarios

    Example Trading Scenarios
    Example Trading Scenarios
    Win Rate Wins (out of 100 trades) Losses (out of 100 trades) Earnings from Wins Losses from Losses Net Profit/Loss
    50% 50 50 $25,000 (50 × $500) -$12,500 (50 × -$250) $12,500 profit
    60% 60 40 $30,000 (60 × $500) -$10,000 (40 × -$250) $20,000 profit
    70% 70 30 $35,000 (70 × $500) -$7,500 (30 × -$250) $27,500 profit
    40% 40 60 $20,000 (40 × $500) -$15,000 (60 × -$250) $5,000 profit
    30% 30 70 $15,000 (30 × $500) -$17,500 (70 × -$250) -$2,500 loss

    Conclusion

    Day trading with a $25,000 account is possible, but your results will depend on your strategy, risk tolerance, and experience. Many active traders aim for daily gains of about 1% to 2%, which equals roughly $250 to $500 a day. However, these numbers can change quickly depending on market swings, unexpected news, and how disciplined you are with your trades.

    Trading fees, taxes, and losing trades will also reduce your profits. If you’re not careful, it’s easy to give back gains just as fast as you make them. That’s why having a clear trading plan and sticking to your risk limits is so important. Some traders use stop-loss orders to protect themselves from bigger losses, and regularly review their performance to spot patterns or mistakes.

    In short, while some traders with a $25,000 account can earn a few hundred dollars a day, it’s not guaranteed. Your success will rely on how well you manage risks, adapt to changing markets, and keep your emotions in check. If you’re just starting, consider practicing with a demo account or starting small before risking your full capital.

  • Using Volume Spread Analysis to Identify Market Strength and Weakness

    Using Volume Spread Analysis to Identify Market Strength and Weakness

    Volume Spread Analysis (VSA) looks at the connection between how much a stock or asset is traded (volume) and how its price moves. This approach helps traders figure out whether buyers or sellers are in control, which can signal if a trend is starting, continuing, or coming to an end. By noticing how trading volume matches up with the size of each price bar on a chart, you can often spot when large institutional traders are making moves. Their activity usually leads to bigger shifts in price, giving individual traders clues about possible changes in supply and demand.

    Learning how volume and price interact can help you make more informed trading decisions. For example, if you see a big price increase on high volume, it could mean strong buying interest, while a price drop on high volume might suggest heavy selling. On the other hand, if the price moves sharply but the volume is low, the move might not last.

    As a trader, using VSA can help you spot opportunities and manage risk more effectively. Instead of relying only on price charts, adding volume analysis gives you a fuller picture of what’s happening in the market.

    What is Volume Spread Analysis

    Volume Spread Analysis, or VSA, is a trading technique that looks at the relationship between price movements, trading volume, and the range between a market’s high and low prices (known as the spread) to better understand what’s happening behind the scenes in the market. By studying these elements together, VSA helps traders spot whether big players—like professional investors or institutions—are buying or selling, even when it’s not obvious from price alone. In essence, VSA aims to reveal the true forces of supply and demand in the market, offering insights into potential future price movements and helping traders make more informed decisions.

    How Accurate is Volume Spread Analysis?

    Volume Spread Analysis (VSA) can be a useful tool for understanding market strength and spotting potential reversals, but its accuracy isn’t guaranteed and can vary based on several factors. While VSA helps traders identify key areas like support, resistance, and value, as well as confirm trends, it’s not foolproof on its own. The method works best when combined with other indicators and trading strategies. Moreover, interpreting VSA charts effectively takes experience, so traders should use it as one part of a broader analysis rather than relying on it solely for trading decisions.

    The Origin and Core Principles of Volume Spread Analysis

    Volume Spread Analysis, or VSA, began with Richard Wyckoff’s research into how price changes and trading volume work together. Wyckoff believed that looking at both price and volume gives a clearer picture of what’s happening in the market.

    For instance, when trading volume picks up during a price move, it often signals that major investors, sometimes called “smart money,” are active in the market. In fact, many traders blend volume analysis with technical analysis fundamentals to pinpoint stronger signals and improve their overall strategy.

    Wyckoff’s main rule—the Law of Supply and Demand—shows how buyers and sellers influence price direction. By comparing the size of the price move, known as the spread, to the volume traded, you can spot if a price jump is likely caused by strong buying or selling. Applying VSA in conjunction with financial ratios can provide a more comprehensive approach to evaluating market conditions, especially for long-term trading decisions.

    This helps traders tell the difference between phases when big players are quietly building positions (accumulation) and times when they’re selling off (distribution).

    Understanding these ideas can make a big difference in how you approach trading. If you watch both the volume and how much price moves, you can get clues about when professional investors might be getting in or out.

    This insight can help you make better decisions and avoid getting caught on the wrong side of big market moves.

    Decoding Candlestick Patterns and Market Sentiment

    Paying attention to individual candlestick patterns is a key part of Volume Spread Analysis (VSA) because each candle shows how buyers and sellers have acted during a specific period. These patterns give you a clear look at the mood in the market. One powerful way to enhance candlestick reading is by incorporating moving averages to help confirm the direction of the prevailing trend.

    For example, the color and size of a candle’s body, along with the length of its wicks, tell you whether buyers or sellers had the upper hand, or if there was hesitation from both sides.

    When you see a candle with a long wick, it often means traders are uncertain, or that a shift in direction might be coming. If you notice a series of candles moving strongly in one direction, this can point to bigger market participants—sometimes called “smart money”—making their moves.

    By matching these candlestick signals with changes in trading volume, you get important clues about whether a trend might continue or reverse.

    For example, after a strong uptrend, a doji candle (where the opening and closing prices are nearly the same) with high volume can signal that buyers are losing strength.

    On the other hand, a bullish engulfing candle during an increase in volume often suggests a new upswing may be starting.

    Combining candlestick analysis with volume gives you a clearer picture of what’s really happening behind the price. This approach helps traders make more confident decisions and respond quickly to changing market conditions.

    Recognizing candlestick patterns such as hammers, engulfing patterns, or dojis not only helps identify shifts in market sentiment, but also provides signals about potential trend reversals or continuations when paired with volume analysis.

    Applying Volume Spread Analysis to Identify Trends and Cycles

    Volume Spread Analysis (VSA) helps traders understand what’s happening behind price moves by looking at how trading volume and price interact. This approach can reveal if large investors are quietly buying (accumulation) or selling (distribution), giving clues about upcoming market moves. By watching volume and price together, you can spot shifts in market sentiment and get a better sense of whether a trend is likely to continue or reverse.

    Key Steps in VSA for Trend and Cycle Recognition

    1. Monitor Price and Volume Together

    Watching price changes alongside volume helps you spot strong moves supported by heavy trading. For example, if a stock jumps higher on much higher-than-average volume, it often signals strong interest from big players. Incorporating stop-loss orders can help you manage risk if a price move does not go as expected.

    2. Look for Volume Spikes During Big Moves

    Large increases in volume during price surges or drops can mark key turning points. A sudden spike in volume after a long quiet period may mean the market is about to change direction.

    3. Spot Accumulation and Distribution Patterns

    Repeated buying on high volume without much price movement often signals accumulation, while heavy selling with little price drop can mean distribution. These patterns help you figure out if a trend is building up or winding down.

    4. Keep an Eye on Smart Money Activity

    Unusual volume patterns can hint at activity from institutional investors. If you notice strong volume and small price changes, it might show that bigger players are entering or exiting positions quietly.

    5. Identify Market Phases for Better Timing

    Breaking the market into phases, like accumulation, mark-up, distribution, and mark-down, gives you a clearer view of where you’re in the cycle. This can help you time your trades more effectively, especially before major breakouts or reversals.

    Incorporating risk management principles from Forex trading can further strengthen your VSA approach, ensuring that you not only identify trends but also protect your trading capital during volatile market cycles.

    Integrating Support, Resistance, and Dynamic Trendlines

    Adding support, resistance, and dynamic trendlines to your charts can help you spot where price changes are most likely to happen. These technical tools highlight areas where buyers or sellers might step in, which often leads to a change in price direction or a pause in movement. Understanding the risk-to-reward ratio is also crucial when evaluating trades around these key levels, as it helps you weigh potential gains against possible losses.

    For example, support zones show where a price drop might stop because buyers see value, while resistance levels mark spots where rallies tend to stall as sellers take profits.

    Trendlines are useful for following shifts in momentum. Adjusting your trendlines when the market changes helps you stay in tune with new price patterns and trends. Incorporating stop-loss orders alongside these chart tools helps limit losses if the market moves against your position. When you see a sharp rise in trading volume at a known support level, or during a breakout above resistance, it often signals that traders are reacting strongly—either defending a price or pushing it to new highs.

    This volume action can show if a move is likely to continue or if it might fade quickly.

    Example: If Bitcoin’s price approaches a strong support area around $40,000 with low volume, it might bounce back. But if volume spikes as it breaks below, that suggests sellers are in control, and the drop could continue.

    Combining these visual cues with volume information can guide your trading decisions. As one experienced trader put it:

    Common Pitfalls and Best Practices in Volume Spread Analysis

    Bringing support, resistance, and trendlines into your volume spread analysis can add valuable insight, but even experienced traders can run into trouble if these tools are used without careful consideration. One frequent mistake is overlooking how trader emotions and sudden shifts in market volatility can impact the meaning of volume data. For example, panic selling during news events often causes volume spikes that don’t always match the usual price-volume relationship.

    Relying Only on Volume Data

    Focusing just on volume numbers—without checking how they line up with price movements—can cause you to misread the real message the market is sending. For instance, a surge in volume might seem bullish, but if the price doesn’t move up along with it, buyers may not have as much strength as the volume alone suggests.

    Being Aware of Volume Distortion

    Volume data can vary between trading platforms because of different data sources or calculation methods. If you don’t notice these differences, your analysis might be off. Always check whether your volume data matches up with reliable sources, especially if you’re switching between brokers or charting tools.

    Factoring in Market Psychology and Phases

    Understanding what motivates traders at different stages of a trend is key. During accumulation, for example, smart money often buys quietly, keeping volume steady while prices rise slowly. In contrast, during distribution, high volume may signal big players selling into strength.

    Sticking to Risk Management

    No analysis is foolproof. Keeping strict risk controls—like using stop losses and position sizing—helps protect your account from unexpected moves, even when your read on the market seems solid.

    It’s especially important to have a disciplined risk management approach in place, as neglecting risk controls can undermine your trading success even when your analysis is otherwise sound.

    Quick Tips:

    • Don’t let raw volume numbers make your decisions for you—always look at price action too.
    • Watch for unusual spikes in volatility, as they can change how you read volume.
    • Check your data sources for consistency, especially if you use more than one trading platform.
    • Think about why traders are acting a certain way at each market phase.
    • Use clear risk management rules to stay in the game long term.

    Conclusion

    Volume Spread Analysis helps you see how price movements relate to trading volume, giving insight into what buyers and sellers are doing in real time. By reading these signals, you can better judge whether a market move is likely to continue or reverse. If you combine VSA with practical tools such as support and resistance levels or trendlines, you’ll spot trends more clearly and reduce the risk of common mistakes, like entering a trade too early or missing key turning points.

    Using these methods together makes it easier to plan your trades and manage risk. For example, if you notice high volume when a price reaches a support level, it might signal strong buying interest. This could give you more confidence to enter a trade or hold your position longer.

  • Forex vs Futures Trading: Which Market Is Better for You?

    Forex vs Futures Trading: Which Market Is Better for You?

    Deciding between choosing forex vs futures trading means looking closely at how each market functions and what fits your needs. Forex trading is known for its decentralized structure, allowing people to buy and sell currencies at nearly any hour of the day. This around-the-clock access often attracts those who want flexibility and the ability to react quickly to global events. In contrast, futures trading takes place on regulated exchanges where contracts follow strict standards for size and expiration dates, which can offer a sense of security for some traders.

    You’ll also want to pay attention to other factors, such as how much you can control with your money (margin requirements), how each market is supervised, and the tools available for managing risk. For example, forex markets usually let you start with a smaller initial deposit, while futures exchanges set clear rules and promote transparency. Both markets have their own set of risks, so understanding these details can help you avoid unnecessary surprises.

    What is Better, Futures or Forex?

    What is Better Futures or Forex
    What is Better Futures or Forex

    Whether futures or forex is “better” really depends on your personal trading goals, risk tolerance, and experience. Futures trading offers a highly regulated, transparent environment with a wide range of assets, but usually requires more capital and can be more complex. Forex is more accessible, requires less starting capital, and trades 24 hours a day, but it’s less regulated and carries risks with broker practices and high leverage. In short, if you value regulation and want to trade more than just currencies (and have enough capital), futures might be better for you. If you prefer flexibility, lower entry costs, and are mainly interested in currency trading, forex could be the better choice. Ultimately, neither is universally better—it comes down to which market better suits your needs and trading style.

    Understanding the Forex Market

    The forex market stands out for its high liquidity, making it the most active financial market globally. Every day, traders exchange more than $6.6 trillion, buying and selling currencies in pairs. This market operates around the clock from Monday to Friday, giving you the flexibility to trade at nearly any hour.

    Because forex trading is decentralized and over-the-counter, you can quickly respond to breaking economic news and global events, which can move prices within minutes. Forex trading involves trading currency pairs, with prices influenced by a wide range of economic and geopolitical factors.

    With access to over 80 different currency pairs, traders have plenty of ways to act on their views about the economy, hedge against risk, or pursue potential profit. For example, major pairs like EUR/USD or USD/JPY tend to attract the most volume, while exotic pairs offer options for those seeking different price movements.

    Building a successful trading approach means keeping an eye on factors like interest rates, inflation reports, and geopolitical developments, all of which can affect currency values.

    Most forex brokers offer competitive bid-ask spreads, helping to keep transaction costs lower compared to other markets. This is especially helpful for those who trade frequently.

    Understanding How Futures Trading Works

    Futures trading means agreeing to buy or sell a specific asset—like oil, gold, corn, or a major currency—at a set price on a specific date in the future. These contracts are standardized, which means the exchange decides on contract details such as the size, expiration date, and the exact type of asset involved.

    Because these contracts trade on regulated exchanges, the process is transparent and consistent for all participants. When trading futures, it is vital to consider risk management strategies to protect yourself from significant losses that can quickly escalate due to leverage. Futures markets also offer enhanced transparency compared to some over-the-counter products, which helps ensure fair pricing for all traders.

    To start trading futures, you don’t need to pay the entire contract value upfront. Instead, you deposit an initial margin, which is a percentage of the contract’s total worth. This allows for greater market exposure, but it also means that gains and losses can be much larger than your original investment.

    That’s why understanding the risks and potential rewards is so important. If prices move against your position, you might have to add more funds to maintain your trade.

    People use futures for different reasons. For example, a farmer might lock in a selling price for their crops to protect against falling prices, while an investor might try to profit from expected price changes.

    The exchange’s clearinghouse plays a key role by making sure trades are settled smoothly and reducing the risk that either party will default.

    Key features of futures trading include:

    • Standardized Contracts: Every futures contract follows specific rules set by the exchange, making it easier to buy and sell.
    • Centralized Exchanges: Trading happens in one place, so prices are clear and fair.
    • Margin Requirements: You only put down part of the contract’s total value, which can increase both profits and losses.
    • Risk and Reward: Because only a fraction of the contract’s value is needed, both potential gains and risks are amplified.
    • Trading Strategies: Some people use futures to manage risk, while others aim to earn a profit from price swings.

    Futures trading can be a useful tool for both companies and individual investors. However, it’s important to learn the basics, understand your financial goals, and use strategies that fit your situation before trading.

    In both futures and forex markets, effective money management is crucial for protecting your capital and optimizing trading outcomes.

    Difference Between Forex and Futures

    Forex and futures markets are both popular ways to trade financial assets, but they have key differences. Forex, or the foreign exchange market, deals exclusively with buying and selling currencies, and trades are usually settled almost instantly or within a very short time. In contrast, futures markets cover a wider variety of assets—including currencies, commodities, stock indices, and more—and involve contracts that settle at a set date in the future. So, while forex is focused solely on immediate currency trading, futures allow for trading many different asset types with agreed-upon settlement dates down the road.

    Weighing the Pros and Cons: Forex Vs Futures Trading

    Choosing between forex and futures trading can shape your strategy and results, so it helps to know what sets these markets apart.

    Forex trading is known for its high liquidity, meaning you can quickly buy or sell currencies almost any time of day. This fast-paced environment allows for quick trades and flexible strategies. However, forex brokers often offer very high borrowing ratios—sometimes up to 500:1—which means even small changes in currency prices can have a big effect on your account. This can work in your favor, but it also means losses can happen just as fast. Careful risk controls matter a lot here. Many traders in the forex market rely on technical analysis tools to identify trends and time their entries and exits effectively.

    Futures trading, on the other hand, uses standardized contracts and typically lower borrowing ratios, often around 20:1. This setup can help limit risk, but it might also restrict your potential gains unless you’re timing your trades well. Futures markets operate with set trading hours and contract sizes, which can make planning easier for some traders.

    Both markets require a solid understanding of risk and how using borrowed funds affects your exposure. If you’re just starting out, you might find the structure of futures easier to manage, while experienced traders often appreciate the speed and flexibility of forex.

    No matter which path you choose, make sure you have a clear plan, stick to your risk limits, and review your strategies regularly. Volatility measurement tools, such as the VIX and historical volatility, can also help you monitor changing market conditions and manage your risk more effectively. That’s how experienced traders stack the odds in their favor.

    Which Market Is Right for Your Trading Strategy?

    Which Market Is Right for Your Trading Strategy
    Which Market Is Right for Your Trading Strategy

    Selecting between the forex and futures markets depends on how you like to trade and what you expect from the market. Each market has its own features that can fit different trading approaches.

    Trading Style and Market Conditions

    Start by thinking about how you handle stress, your reaction time to breaking news, and your comfort with price swings.

    Forex markets run 24 hours during the business week, so you can trade almost any time, which works well if you like to respond quickly to global events. On the other hand, futures markets have set trading hours and offer contracts on everything from currencies to commodities, making them a good fit if you prefer a more structured environment.

    Liquidity and Flexibility

    Forex is known for its high liquidity, especially with major currency pairs. That means you can usually buy or sell without much slippage, which is important if you use fast-moving strategies or trade large amounts.

    Futures also offer deep liquidity, but mostly for popular contracts like the S&P 500 or crude oil. If you want a wider range of instruments, forex may suit you better.

    Risk Management and Costs

    Consider how you handle risk and what kind of margin requirements you’re comfortable with.

    Forex brokers often allow you to control larger positions with a smaller deposit, but this can increase both potential gains and losses. Futures have standardized contracts and clear margin requirements, which can make it easier to manage your exposure and understand your costs.

    Transparent fees in futures can appeal to traders who want to know their exact transaction costs upfront.

    Technical Analysis and Trading Tools

    Think about how you use charts and indicators. Both markets support technical analysis, but some traders find that the high liquidity in forex leads to smoother chart patterns.

    Futures markets, thanks to their structure, can be easier to analyze for certain technical setups, especially if you focus on a specific contract.

    Trading Hours and Personal Schedule

    If you need flexibility because you trade around a busy schedule, forex’s round-the-clock access is a big advantage.

    Futures are best if you like the discipline of set trading hours and want to avoid overnight surprises.

    Key Points to Consider:

    • How quickly do you want to react to market news? Forex allows for fast responses, while futures are more structured.
    • Are you comfortable with using margin? Forex offers higher margin, but with greater risk. Futures margins are standardized.
    • Which instruments do you want to trade? Forex gives access to numerous currency pairs; futures offer a variety of contracts.
    • How important are trading hours to you? Forex runs nearly non-stop, futures have set hours.
    • What type of fee structure do you prefer? Futures offer transparent costs, forex fees vary by broker.

    Both forex and futures have their strengths. The best choice comes down to your own trading style, risk tolerance, and goals.

    Try out both markets with demo accounts to see which one feels right for you. If you want more insight on optimizing your approach, consider studying technical analysis tools to refine your trading strategy and decision-making.

    Conclusion

    If you’re deciding between forex and futures trading, it helps to think about how much risk you’re comfortable with, your preferred trading hours, and whether you want a more flexible or structured market. Forex trading stands out for its high liquidity and the ability to trade around the clock, making it popular for people who want to trade outside regular business hours or react quickly to global news.

    On the other hand, futures trading involves standardized contracts and is often done through regulated exchanges. This can offer more transparency and set rules, which some traders find reassuring. Futures markets can be a good fit if you value a clear structure and want to trade commodities or stock indexes.

    Both markets come with specific rules about margin and available capital. For example, forex typically offers higher margin rates, allowing traders to control larger positions with less money upfront, but this also means the risks can be higher. Futures require set amounts of capital for each contract, so your exposure is clearer from the start.

  • Proprietary trading vs hedge funds

    Proprietary trading vs hedge funds

    Understanding the difference between proprietary trading firms and hedge funds helps explain how each operates in the financial markets. Proprietary trading firms, often called “prop shops,” trade with their own capital. Their main focus is to profit from short-term price changes in stocks, bonds, or other assets. These firms often use advanced trading technology and algorithms to make quick decisions. Since they use their own money, they can take more risks and react quickly to market changes.

    Hedge funds, on the other hand, collect money from outside investors. These investors expect steady returns over time, so hedge funds use a wider variety of strategies, such as long/short equity, global macro, or event-driven trades. Because hedge funds manage other people’s money, they face more regulations and must provide regular reports to their investors. For example, while a prop firm might try to make money from rapid price swings in tech stocks using high-speed trading, a hedge fund might try to deliver stable returns by holding a mix of stocks, bonds, and derivatives. in this article, we will discuss about Proprietary trading vs hedge funds

    What is The Difference Between Proprietary Trading and Hedge Funds?

    What is The Difference Between Proprietary Trading and Hedge Funds
    What is The Difference Between Proprietary Trading and Hedge Funds

    Proprietary trading and hedge funds are both active in the financial markets, but their structures, goals, and the way they operate are quite different.

    Proprietary trading vs hedge funds, what are the differences? Proprietary trading involves firms using their own money to buy and sell financial instruments. Traders in these firms make decisions quickly, responding to real-time market changes. Since they’re dealing with the company’s money, any gains or losses directly impact the firm’s financial health. This setup often leads to a fast-paced environment, where quick thinking and discipline play a big role in success. For example, many trading firms in New York or London have teams who focus on split-second trades in stocks, bonds, or derivatives. Many proprietary trading firms also offer support, resources, and mentoring programs to help traders refine their strategies and succeed in high-pressure environments. In addition, it’s important for traders to understand risk parameters that are established and communicated upfront to ensure alignment with firm expectations.

    Hedge funds, on the other hand, manage money collected from outside investors. Their managers invest this pooled capital into a range of assets, often with a strategy aimed at achieving steady returns over time.

    Because they’re handling other people’s money, hedge funds must follow strict regulations and report certain details when they reach a specific size. If a hedge fund makes a bad investment, it’s the investors—not just the firm—who share in those losses.

    This responsibility tends to make hedge fund managers more cautious and focused on protecting their clients’ capital.

    Both approaches carry risks, but the impact of those risks falls on different people. In prop trading, the firm itself absorbs the ups and downs, while in hedge funds, investors share in the results.

    A major distinction is that proprietary trading firms often provide access to substantial capital for their traders, which can enhance potential gains but also increases the stakes involved.

    Do Prop Traders Get a Salary?

    Yes, prop traders can receive a salary, though the structure varies depending on the firm. Some proprietary trading firms offer a base salary to their traders, especially at the entry level, where earnings can range from $50,000 to $120,000 per year. More experienced or senior traders often make over $150,000 annually, and many firms also provide additional income through bonuses or profit-sharing arrangements. In summary, while not all prop trading roles guarantee a fixed salary, many do offer a combination of salary and performance-based compensation.

    Core Strategies and Investment Approaches

    Investment strategies are at the heart of both proprietary trading firms and hedge funds, but their goals and day-to-day practices show clear differences.

    Proprietary Trading: Fast-Paced, Short-Term Tactics

    Proprietary trading firms use their own money to try to make a profit from quick changes in the market. They often focus on short-term tactics such as high-frequency trading, market making, and arbitrage.

    These approaches depend heavily on technology and detailed mathematical models to buy and sell large amounts of stocks, currencies, or other assets in just fractions of a second. The aim is to benefit from small price movements, often without holding positions for more than a few minutes or even seconds.

    For example, a prop trading desk might use automated systems to spot and act on price differences between exchanges. Some modern prop firms now offer immediate access to capital, allowing skilled traders to start trading without lengthy evaluation processes.

    Hedge Funds: Broader Mix With Risk Management

    Hedge funds, by contrast, use a wider range of strategies and usually manage money for outside investors. Their goal is to deliver steady returns while protecting against losses.

    They might take both long and short positions, invest in global markets, or focus on events like mergers. Some well-known hedge fund strategies include long/short equity, global macro, and event-driven investing.

    Hedge funds typically spend more time on detailed research and spread their investments across different assets to manage risk. For instance, a hedge fund manager may analyze company earnings, economic data, or political developments to decide where to invest.

    Key Differences in Approach and Objectives

    While both groups use advanced technology and data analysis, proprietary traders usually move faster and trade more frequently, aiming for quick wins using the firm’s own funds.

    Hedge funds, on the other hand, often take a longer view and balance risk and reward for their investors. A key tool used by both is risk management practices, which help ensure that trading strategies protect against significant losses and maintain long-term profitability.

    Regulatory Environment and Oversight

    Understanding how regulations affect proprietary trading firms and hedge funds helps explain why they operate differently. Proprietary trading firms typically use their own money to make trades and don’t manage outside clients’ assets. Because of this, they face fewer regulatory requirements and less oversight from agencies like the Securities and Exchange Commission (SEC).

    These firms aren’t required to register as investment advisors or provide as much information to the public, allowing them to keep their strategies more private. Effective risk management is particularly important for proprietary trading firms, as they rely on internal controls rather than regulatory mandates to safeguard their capital. A key part of their approach is setting clear rules to keep emotions in check and limit potential losses.

    On the other hand, hedge funds manage money for outside investors. This role comes with more responsibilities and stricter rules. Once a hedge fund’s assets under management cross certain thresholds, the fund must register with the SEC.

    This registration requires the fund to regularly file reports, share details about its holdings, and meet standards designed to protect investors. Hedge funds also must follow Anti-Money Laundering (AML) and Know Your Customer (KYC) policies, which are meant to prevent illegal activities and ensure they know who their clients are.

    These rules increase transparency and help build trust with investors and regulators.

    There are also rules that affect how banks can use their own funds for trading. The Volcker Rule prevents banks from engaging in most forms of proprietary trading, but it doesn’t apply to hedge funds in the same way.

    As a result, hedge funds have more freedom in choosing their investment strategies, while bank-affiliated proprietary trading desks must limit their activities.

    Proprietary trading firms often keep a low profile, disclosing less information to the public since they don’t handle client money. In contrast, hedge funds must be more open about their operations because they’re responsible for protecting their clients’ interests and following the law.

    This difference often influences the types of strategies each firm can pursue. Firms that operate as proprietary traders may also place greater emphasis on risk and money management to ensure sustainable performance without the burden of external oversight.

    Compensation Structures and Profit Sharing

    Proprietary trading firms and hedge funds both aim to generate profits in financial markets, but the way they pay their teams is quite different. At most prop trading firms, you keep a significant share of the profits you make—sometimes as much as 90%. This setup puts the focus on your personal results, so traders who perform well can see large payouts. A key part of success for many prop traders comes from emotional discipline, which helps avoid impulsive decisions and supports consistent performance.

    There’s usually a base salary, but the real money comes from performance-based bonuses, which can vary a lot from year to year.

    Hedge funds, on the other hand, use a different model. Managers usually earn a set annual fee, about 2% of the assets they’re managing, plus a performance fee—often 20% of the fund’s profits. Here, payouts depend on how well the entire fund does, not just one person’s trades. If the fund grows and delivers strong returns for its investors, everyone benefits.

    This approach can encourage teamwork, since compensation is tied to the overall success of the fund rather than only to individual performance.

    Understanding these differences helps you decide which environment might suit your skills and goals best. Prop trading often appeals to those who prefer to work independently and take bigger risks for bigger rewards. Hedge funds might attract people who want more stability and like working as part of a larger team.

    Performance and Risk in Different Market Conditions

    Financial professionals often study how hedge funds and proprietary trading firms handle different market environments because understanding these differences can help investors make better decisions.

    Hedge funds usually take a cautious approach by spreading their investments across a range of assets and using methods like long/short equity strategies. This means they buy some stocks and sell others short, which can help offset losses if the market drops. Their primary goal is to reduce the risk of large losses and deliver steady results, which is important for meeting the expectations of their investors. A key component of these strategies is effective risk management, which helps hedge funds maintain capital preservation even during volatile periods.

    Proprietary trading firms, on the other hand, tend to focus on quick trades that take advantage of short-term price swings. They often do well when markets are unpredictable because their strategies are built around spotting momentum and rapid changes. However, this approach comes with higher risk. If the market suddenly moves against their positions, these firms can face significant losses, especially since they often use borrowed money to amplify returns.

    For example, during the market volatility seen in 2022, some proprietary trading firms reported gains above 30% in a matter of months, while many hedge funds aimed for more modest but consistent returns, often in the single digits. The trade-off is clear: prop trading firms can see big profits in active markets, but they also run the risk of steep losses. Hedge funds may not match those high returns during boom times, but their strategies are designed to protect against sharp declines.

    Your approach to risk should line up with your personal investment goals and how you see the market evolving. If you value stability and lower risk, hedge funds may be a better fit. If you’re comfortable with higher risk for the chance at larger gains, proprietary trading might be worth considering.

    It’s important to note that both strategies benefit from comprehensive risk management to help protect capital and minimize the impact of unpredictable market movements.

    Proprietary Trading Example

    Proprietary Trading Example
    Proprietary Trading Example


    Institution ABC Bank
    Prop Trading Desk Capital $100 million (bank’s own capital, not client funds)
    Step 1: Market Analysis Traders identify TechCo’s stock as undervalued compared to competitors
    Step 2: Taking a Position $10 million worth of TechCo shares purchased using ABC Bank’s own funds
    Step 3: Outcome (Example) Stock rises 20% → position value becomes $12 million
    Profit $2 million profit (excluding transaction costs) goes directly to ABC Bank
    Contrast: Client Trading vs. Prop Trading – Client Trading: Profits/losses belong to client; bank earns fees/commission.
    – Prop Trading: Bank assumes all risks and keeps profits/losses.

    Conclusion

    Understanding how proprietary trading firms and hedge funds operate can help you choose the right path for your financial interests. Proprietary trading firms use their own money to make fast trades, often relying on advanced technology to quickly buy and sell stocks, bonds, or other assets. Their main goal is to make a profit for the firm itself, so they often focus on short-term opportunities and adapt rapidly to market changes.

    On the other hand, hedge funds collect money from outside investors and manage these funds using a wide range of strategies. Hedge funds might hold investments for longer periods and often use more diverse approaches, including stocks, bonds, derivatives, and even real estate. They work to deliver returns for their investors, so their strategies are often more complex and designed to balance risk and reward over time.

  • How Much Can You Make Day Trading With 100K

    How Much Can You Make Day Trading With 100K

    Starting out with a $100,000 account for day trading gives you a decent amount of capital, but your results will depend on your approach, how well you manage risks, and what the markets are like. Most experienced day traders try to make between 0.1% and 0.5% profit each day. For example, this could mean aiming for $100 to $500 in daily gains. Some traders go after larger returns, but this also means taking on much higher risks, which can quickly lead to big losses.

    How Much Can You Make Day Trading With 100k?

    How Much Can You Make Day Trading With 100k 1
    How Much Can You Make Day Trading With 100k 1

    If you have a $100,000 account for day trading, your potential earnings will depend on your approach, how you manage risk, and what the markets are doing at any given time. Factoring in a risk-to-reward ratio is crucial when setting your targets and deciding which trades to take.

    Most experienced day traders aim for daily profits in the range of 0.1% to 0.5%. That works out to about $100 to $500 per day. Some traders use aggressive techniques and try for 1% to 2% gains per day, or $1,000 to $2,000, but this comes with much higher risk and requires a strong track record.

    On a monthly basis, reasonable expectations are typically between 2% and 4% returns, which means earning $2,000 to $4,000 per month. Over the course of a year, profits can range anywhere from 20% to 100% of your original account size, but staying consistent is key, and this level of performance is challenging to maintain. Developing solid risk management practices is crucial to help you navigate losses and avoid depleting your trading account.

    Market conditions can change quickly, so being able to adjust your strategy is often what separates successful traders from the rest.

    If you’re considering day trading with 100k, take time to build a solid plan, keep learning, and stay disciplined—especially during volatile times. Even with a sizable account, patience and a clear strategy are vital for long-term growth.

    Can You Make a Living Day Trading with 100K?

    Yes, you can potentially make a living day trading with $100,000, but it depends on your experience, discipline, and ability to manage risk. With a conservative goal of earning 2-4% per month, you could make $2,000-$4,000 monthly, or $24,000-$48,000 a year—enough for a modest living depending on your expenses and where you live. However, day trading is risky and most traders face losses, so success isn’t guaranteed. Besides having adequate capital, you’ll need a solid trading strategy, strong risk management skills, and a reliable trading platform to increase your chances of making a consistent income from day trading.

    Key Risk Management Techniques for Day Traders

    Day trading can be profitable, but it comes with real risks that can quickly erode your account if you’re not careful. Setting clear rules for risk management is a must if you want to protect your money over the long run. To safeguard your trading capital, it’s important to understand and address market volatility, which can lead to sudden and unexpected losses.

    By knowing your own risk limits, you decide how much of your $100,000 portfolio you’re comfortable putting on the line for each trade. Carefully choosing your trade size and using stop losses can help prevent a single bad trade from wiping out a large chunk of your account. Effective risk management is not just about limiting losses, but also about protecting trading capital for future opportunities.

    These tools also help take emotion out of your decisions, so you don’t panic and make mistakes under pressure. Reviewing your trades regularly gives you the chance to see what’s working, what isn’t, and adjust your strategy as the markets change.

    Practical Steps for Managing Risk:

    • Risk only 1–2% of your capital on any single trade. For a $100,000 account, that means no more than $1,000–$2,000 at risk per trade.
    • Use stop loss orders to automatically close losing trades before the loss becomes too large.
    • Adjust your position size based on how much you’re willing to lose, not just on how confident you feel.
    • Aim for trades where your potential reward is at least twice as large as your potential loss (a minimum 1:2 risk-reward ratio).
    • Go over your trade history at least once a week to spot patterns and make needed changes.

    In addition, understanding exchange rate risk and other market-specific risks is crucial for building a resilient trading plan and achieving long-term success.

    Challenges and Pitfalls of Trading With $100,000

    Handling Psychological Pressure

    Trading with a $100,000 account can feel very different from working with smaller sums. The stakes are higher, so it’s normal to experience more stress and anxiety.

    Even experienced traders can find themselves second-guessing decisions or feeling pressure to perform. This can sometimes lead to impulsive trades or hesitation, both of which can hurt your results.

    It helps to set clear rules for yourself and stick to a consistent trading routine, so emotions don’t get in the way.

    Avoiding Overtrading and Maintaining Discipline

    A larger account often tempts traders to take more trades, thinking they can handle bigger swings.

    However, overtrading can quickly eat into profits and rack up losses. It’s easy to lose track of risk when you feel you have a financial cushion, but one or two big mistakes can wipe out weeks of progress.

    Sticking to your trading plan and setting daily or weekly limits on the amount you risk is a smart way to avoid costly errors.

    Tax Considerations with Larger Accounts

    As your profits grow, so does your tax responsibility. Many traders overlook tax planning until the end of the year, only to be surprised by how much they owe.

    It’s smart to track your trades and work with a tax professional to find legal ways to reduce your tax bill. For example, using tax-loss harvesting or keeping detailed records can help you keep more of what you earn.

    The Importance of Solid Risk Management

    Having a large account can give you confidence, but it’s important not to get complacent. Without solid risk management, a few losing trades can lead to significant losses.

    Using stop-loss orders, only risking a small percentage of your account per trade, and reviewing your performance regularly are all proven ways to protect your capital.

    A key factor in keeping your account safe is understanding the importance of risk management and how it helps balance potential gains with the risk of substantial losses.

    Trading for Yourself vs. Prop Firms: Weighing Your Options as a Day Trader

    Trading for Yourself vs Prop Firms
    Trading for Yourself vs Prop Firms

    If you have $100,000 to trade with, deciding between managing your own account or joining a proprietary trading firm can shape your profits and risks in different ways. Here’s a breakdown to help you figure out what fits best with your goals and personality.

    Trading Independently: Freedom and Full Responsibility

    Trading on your own gives you complete control over your strategies, decisions, and profit. You keep everything you earn, but you’re also fully responsible for any losses. There’s no one to answer to, but there’s also no safety net or extra resources.

    This route might appeal to traders who value independence and have confidence in their ability to manage stress, especially during volatile markets.

    Prop Firms and Trading Companies: Access to More Capital and Support

    Joining a prop firm or financial company changes the setup. Prop firms usually offer access to more capital, which can increase your potential returns. However, you’ll share your profits—often anywhere from 33% to 80%—with the firm, depending on their policies and your track record.

    In return, you may get access to better technology, risk management tools, and a community of other traders.

    If you work as a company trader, you might receive a base salary. Profit sharing in these settings is usually lower, often between 10% and 30%. The salary provides some stability, which can help reduce stress, but your total earnings may be limited compared to trading for yourself or at a high-paying prop firm.

    Comparing the Two Paths

    • Independence: Trading solo means you make all the decisions and keep all the profits, but you’re also responsible for all the losses.
    • Profit Sharing: Prop firms let you use more capital, but you’ll share a portion of your profits with them. The split can vary widely.
    • Salary and Lower Risk: Company traders often get a salary plus a smaller share of profits, offering some financial security.
    • Risk and Reward: You can potentially earn more at a prop firm due to the larger capital, but the risk is also higher because you’re usually trading firm money and must follow strict rules.

    Key Considerations

    No matter which path you choose, the financial and emotional pressures are real. Losses can be tough to handle, especially when you’re risking your own savings or working under performance targets.

    Think carefully about your risk tolerance, experience level, and what matters most to you—independence, stability, or higher earning potential.

    It’s also worth noting that prop trading firms often provide valuable training and mentorship opportunities, which can be especially helpful for beginners looking to develop their skills and confidence.

    100K Funded Account Price

    The price of a $100K funded account depends on the prop firm you choose. Here are prices for some popular prop firms offering a $100,000 funded account (standard one-phase or two-phase evaluation challenges):

    Prop Firm $100K Challenge Model
    FTMO €540 (≈$575 USD) 2-phase evaluation
    MyFundedFX $499 USD 2-phase evaluation
    My Forex Funds $499 USD 2-phase evaluation
    The Funded Trader $549 USD 2-phase evaluation
    E8 Funding $508 USD 2-phase evaluation
    True Forex Funds €499 (≈$530 USD) 2-phase evaluation
    FundYourFX $199 USD Instant Funding

    Conclusion

    With a $100,000 account, your day trading profits depend on your trading strategy, how much risk you’re willing to take, and your ability to keep emotions in check. On average, many experienced traders aim for daily returns between 0.1% and 0.5%. That works out to $100 to $500 per day, but it’s important to realize that these numbers can change depending on market conditions and your own consistency.

    Pushing for higher returns can be tempting, but it also means you’re taking on more risk, which can lead to bigger losses. Many professionals focus on limiting losses and sticking to a plan, rather than chasing big wins. For example, setting a maximum loss per day or per trade can help protect your account from sudden swings.

    If you’re trading on your own or with a prop firm, sticking to a clear set of rules is key to lasting success. Day trading isn’t a way to get rich quick—it’s more about steady, manageable growth over time.

  • How to Become a Funded Trader

    How to Become a Funded Trader

    If you want to become a funded trader, it helps to know exactly what proprietary trading firms expect from applicants. These companies usually offer trading accounts to skilled traders who can show they understand risk, consistently reach profit goals, and keep their emotions in check during volatile markets. Before you apply, take time to review the requirements and choose a program that matches your trading approach—some firms focus on futures, while others back forex or stocks.

    Most firms use evaluation programs to test your skills. You’ll need to follow strict risk limits, like daily loss caps or maximum drawdown levels, and hit specific profit targets within a set period. Many traders find these rules challenging, even if they’ve traded their own money before. For example, if a firm asks for a 10% profit in 30 days without losing more than 5% at any time, you’ll need to be very precise with your strategy.

    It’s also important to understand the fees involved. Some programs charge a monthly subscription or a one-time evaluation fee, so weigh the costs against the potential benefits. Read the rules carefully—some firms may have rules about trading during news events or holding positions overnight.

    Choosing the right firm can make a big difference. Look for companies with clear payout policies, responsive support, and a good reputation among traders. Popular examples include FTMO, Topstep, and The5ers, each with their own set of rules and rewards.

    What Does It Mean to Be a Funded Trader?

    What Does It Mean to Be a Funded Trader
    What Does It Mean to Be a Funded Trader

    Trading with a prop firm’s money puts you in a unique position. Instead of risking your own cash, you use the company’s capital, which lets you trade with larger accounts than most individuals could afford on their own. Many prop firms offer attractive profit splits—some allow you to keep up to 95% of the profits, depending on their payout structure.

    Is it Hard to Become a Funded Trader?

    Many proprietary trading firms require aspiring traders to complete an evaluation or “challenge” before granting access to a funded account. During this period, traders must demonstrate consistent profitability and effective risk management. This is usually measured by achieving predefined profit targets while staying within set maximum drawdown limits. The evaluation helps the firm ensure that traders can trade responsibly and align with the firm’s risk guidelines before allocating real capital.

    Responsibilities and Expectations

    As a funded trader, you’re expected to do more than just buy and sell. You have to follow the firm’s risk rules, which often include limits on how much you can lose in a day or overall (called drawdown limits).

    These rules are there to protect both you and the firm from big losses. Managing your trades carefully and sticking to these limits is key.

    Profit Sharing Models

    Each company has its own way of sharing profits. Some might offer a higher percentage, while others provide extra support or resources.

    Your earnings depend on how well you trade and the agreement you sign. Always read the terms closely so you know exactly what to expect.

    The Mental Side of Trading

    Trading with someone else’s money comes with its own pressures. You need discipline, patience, and the ability to stay calm when markets get volatile.

    Many successful traders say that understanding your own emotions is just as important as knowing your trading strategy.

    Community and Support

    Most prop firms offer training, tools, and sometimes a community of other traders. This support can help you learn faster, pick up new strategies, and stay accountable. Connecting with other traders is a good way to keep improving.

    In short, being a funded trader means following strict guidelines, using someone else’s money to trade, and having the chance to earn real profits if you perform well.

    If you’re disciplined and ready to learn, it can be a rewarding way to grow your skills and income in the world of trading. Many beginners find success by starting with quality instruction and choosing reputable prop trading firms that offer fair profit-sharing and solid support.

    How to Become a Funded Trader?: Steps to Qualify

    To start trading with a proprietary firm’s money, you’ll first need to prove you can handle the responsibility. Most firms run a two-step evaluation process that gives you the chance to show your trading skills, discipline, and ability to manage risk. This usually happens in a practice account using the trading platform the firm supports. Practicing proper position sizing during this phase can help demonstrate to the firm that you understand how to manage risk effectively.

    Meeting Profit Targets and Risk Rules

    During the evaluation, you’ll be asked to hit specific profit goals while following clear risk management rules. One common rule is to keep your losses below a set percentage—typically, you can’t lose more than 10% of your starting balance.

    These guidelines help the firm see if you can protect capital, not just make gains. Some programs allow you to complete the evaluation in as few as ten trading days, as long as you meet all their requirements.

    Moving to Real Capital

    Once you pass both evaluation phases, you’ll go through a verification step. This might involve confirming your identity and making sure you followed all the rules during the test period.

    After you clear these checks, you’re given access to a funded trading account. At that point, you can start trading with the firm’s money and share in any profits you make.

    It’s important to recognize that the high failure rate of prop firm challenges highlights the need for strong risk management and emotional discipline throughout the evaluation process.

    This process gives traders a fair shot at accessing larger capital, while firms protect themselves by only backing those who’ve shown they can trade responsibly.

    Key Evaluation Criteria and How to Succeed

    Working toward a funded trading account takes commitment and a clear understanding of what prop firms expect from applicants. Most firms set specific targets, such as reaching an 8% profit while keeping losses below a 10% drawdown. These rules are in place to find traders who can balance risk and reward over time.

    Why Consistency and Discipline Matter

    Firms pay close attention to how you handle risk and whether you stick to your trading strategy. For example, a trader who hits profit targets but often breaks risk limits may not pass the evaluation.

    Keeping detailed records of every trade allows you to spot patterns, see where you excel, and correct mistakes. This habit can make a big difference in your results.

    Essential Habits for Success

    To improve your chances, keep these points in mind:

    • Follow the profit and risk guidelines set by the firm on every trade.
    • Build a trading plan before you start and review it regularly.
    • Track your daily results and reflect on what’s working or not.

    Pass rates for most prop firm evaluations tend to be low, with estimates suggesting only about 5% to 20% of applicants successfully meet all the requirements due to the strict risk management rules and psychological pressure involved.

    How to Choose the Best Funded Trading Program?

    Picking a funded trading program takes more than just glancing at profit splits or flashy advertisements. Start by looking closely at each firm’s evaluation process. Some programs offer a single challenge, while others require you to pass several stages before you can trade with their capital.

    If you prefer a straightforward path, a one-step evaluation might suit you better. On the other hand, a multi-phase process could be a better fit if you’re comfortable with more detailed requirements.

    Check Profit Targets and Drawdown Limits

    Every funded account program sets rules around how much profit you need to make and how much you can lose before failing the challenge. For example, some firms set maximum drawdown limits at 5%, while others might allow a bit more flexibility.

    Make sure these rules match your trading style and risk tolerance. If you usually trade conservatively, a program with strict drawdown limits could work for you. Aggressive traders may want to find a firm with more lenient rules.

    Understand the Payout Structure

    Profit splits can vary widely. Some programs let traders keep 80% of profits, while others offer up to 95%.

    Don’t just look at the top number—read the fine print to see if there are any hidden fees or payout conditions. For instance, some firms only pay out after you reach a certain profit threshold or require you to complete additional verification steps before receiving money.

    Read Trader Reviews and Community Feedback

    Real feedback from other traders can reveal a lot about a firm’s reliability and payout speed. Look for testimonials that mention the withdrawal process and the overall user experience.

    Reliable payout histories and responsive customer support are good signs.

    Evaluate Support and Educational Resources

    Some trading firms offer learning materials, webinars, or active online communities. These resources can help you learn new strategies and stay motivated.

    Being part of a supportive group or having access to helpful guides can make it easier to grow as a trader.

    Maximizing Success After Gaining Funded Status

    Earning funded trader status is a big step in your trading journey, but your real progress depends on what you do next. Staying consistent and sticking to your trading plan will help you avoid emotional decisions that can quickly drain your account.

    As you move forward, take advantage of available resources like coaching sessions, performance analytics tools, and educational content to fine-tune your approach and stay prepared for changing market conditions.

    Focus on Payouts and Account Safety

    Getting paid should be at the top of your list, so make sure you understand the rules around withdrawals, such as the required number of profitable days and profit targets.

    Pay close attention to your account’s drawdown limits and how profit-sharing works. Knowing these details helps you protect your earnings and avoid unnecessary setbacks.

    Stay Active in the Trading Community

    Connecting with other traders can be a game changer. Join live trading sessions and forums where you can share ideas and learn from others’ experiences.

    These interactions often bring fresh perspectives and tips that you can apply to your own strategy.

    Daily Habits That Support Long-Term Success

    • Check your trading statistics every day and adjust your strategy if you spot any weaknesses.
    • Participate in live discussions or community groups to stay in tune with market trends.
    • Keep a close watch on your account balance to make sure you’re within drawdown rules.

    Remember, building a solid foundation with risk management strategies is essential for protecting your capital and ensuring your long-term success as a funded trader.

    Best Funded Trading Accounts

    If you’re searching for the best funded trading accounts, FundYourFX stands out with its instant funding model, high profit sharing of up to 95%, and no time limits or minimum trading days. Traders can choose from various account tiers, starting at just $199 for a $5,000 simulated balance, scaling up to $3,299 for a $100,000 account with growth potential up to $3 million. With generous scaling targets, flexible leverage of up to 1:100, and refund options available, FundYourFX offers a competitive, trader-friendly environment that prioritizes real capital growth without the delays of traditional evaluations.

    Best Funded Trading Accounts
    Best Funded Trading Accounts

    Conclusion

    Choosing a trustworthy proprietary trading firm is the first step. Look for firms with transparent rules, fair profit splits, and a strong reputation among traders. Reviews on community forums or sites like Trustpilot can help you avoid scams and find firms that actually pay their traders.

    In summary, funded trading is about more than just hitting profit targets. It’s about building habits that protect your account, improve your skills, and help you grow as a trader. By taking a careful, disciplined approach and making use of available resources, you can increase your chances of long-term success in proprietary trading.

  • Step-by-Step Guide: How to Read a Candle Chart for Trading Success

    Step-by-Step Guide: How to Read a Candle Chart for Trading Success

    A candlestick chart gives you a clear picture of price changes in a set time period. Each candle shows four key numbers: the opening price, closing price, highest price, and lowest price for that period. The body of the candle marks the difference between where the price started and ended, while the thin lines (called wicks or shadows) show the highest and lowest points reached.

    The color of a candle matters. For example, a green or white candle usually means the price went up, while a red or black candle means the price dropped. The shape and length of the candle’s body and wicks can signal what traders are thinking. A long body suggests strong buying or selling, and short bodies may hint at indecision. If you spot a candle with a tiny body but long wicks on both ends, it could mean the market is unsure about where to go next.

    What is a Candlestick?

    A candlestick is a visual tool used in financial markets to represent the price movement of an asset, such as a stock or currency, over a certain period. Each candlestick on a chart shows four key pieces of information: the opening price, the highest and lowest prices reached, and the closing price during that time frame. This method makes it easy for traders and investors to quickly understand how an asset’s price has changed and to spot patterns or trends in the market, helping them make informed decisions.

    What is The 3 Candle Rule?

    The “3 candle rule” in trading refers to a set of candlestick patterns formed by three consecutive candles on a price chart. These patterns are used in technical analysis to help traders predict possible trend reversals or continuations in the market. By analyzing the shapes, sizes, and colors (bullish or bearish) of these three candles, traders can gauge market sentiment and make more informed trading decisions.

    Common examples of three-candle patterns include:

    • Three White Soldiers: A bullish reversal pattern formed by three consecutive long green (or white) candlesticks, each closing higher than the previous one, typically after a downtrend.
    • Three Black Crows: A bearish reversal pattern consisting of three consecutive long red (or black) candlesticks, each closing lower than the previous one, usually after an uptrend.
    • Three Inside Up/Down: A pattern that signals a potential reversal, where the first candle is large, the second candle is contained within the first, and the third candle confirms the reversal by closing beyond the range of the first candle.

    Traders use these three-candle patterns to interpret shifts in momentum and market psychology, helping them identify potential entry and exit points for trades.

    What is The 5 Candle Rule?

    The 5 candle rule is a trading strategy designed to help traders spot reliable trend reversals and avoid false signals. It works by observing a specific pattern over five consecutive candlesticks: first, a long bearish candle, followed by three smaller bearish candles, and finally a strong bullish candle that closes above the midpoint of the initial bearish candle. By waiting for this five-candle sequence, traders can more confidently identify when a market trend might be reversing, as the pattern helps confirm the shift in momentum and filters out noise that often misleads traders using lagging indicators.

    How to Read Basic Candlestick Charts for Trading

    Understanding how to read candlestick charts for beginners is a key skill for anyone interested in trading. Each candlestick shows four important details about price: where the price opened, where it closed, the highest point, and the lowest point during a specific time period. The color of the candlestick also has meaning. A green (or white) candle usually means the price went up during that period, which many traders see as a sign of buying pressure. On the other hand, a red (or black) candle shows the price dropped, pointing to more selling activity.

    Why Candlestick Colors Matter?

    Green candles are linked to upward momentum, while red candles signal downward movement. By watching how these candles form and line up, you can spot shifts in market sentiment. For example, a long red candle after a series of green ones may hint that sellers are starting to dominate, which could lead to a trend change.

    The Role of Timeframes and Volatility

    The timeframe you choose—like one minute, five minutes, or daily—affects what the candlestick tells you. Shorter timeframes often show more price swings, which can make trading riskier. If you’re a beginner, focusing on longer timeframes may make it easier to spot clear trends and avoid making hasty decisions.

    Volatility also plays a big role in interpreting candlestick patterns. In fast-moving markets, candles can change quickly and may give false signals. Keeping an eye on volatility helps you decide when to be cautious and when to act.

    Using Candlestick Patterns in Your Trading Plan

    Learning to read candlestick charts helps you make more informed choices, rather than relying on gut feelings. For example, if you see a pattern like a “hammer” after a price drop, it may suggest buyers are stepping in. Combining these patterns with other tools, such as moving averages or volume, can give you a clearer picture of what’s happening in the market.

    “Candlesticks don’t predict the future, but they give traders a snapshot of crowd psychology in real time.”

    You can build your confidence by practicing with risk-free practice accounts that allow you to refine your strategy before trading with real money.

    If you want to practice, many free charting platforms like TradingView or MetaTrader offer live candlestick charts that let you test what you’ve learned without risking real money.

    Anatomy of a Candlestick

    A candlestick is a common charting tool used by traders to track price changes within a set period, such as five minutes, an hour, or a day. Each candlestick shows four main points: the opening price, the closing price, the highest price, and the lowest price for that timeframe. Because candlesticks can show sudden shifts in direction, it’s important for traders to pay attention to emotional control when interpreting their meaning in fast-moving markets.

    The thick part of the candlestick, called the “body,” marks the range between where the price started and ended. If the closing price is higher than the opening price, the body is usually colored green or white, showing the price went up. If the closing price is lower, the body is often red or black, showing a drop in price. A long body means there was strong movement in one direction, while a short body suggests buyers and sellers were more evenly matched. Because candlesticks are so widely used, risk management remains an important part of interpreting their signals and making trading decisions.

    Thin lines, known as “shadows” or “wicks,” stick out from the top and bottom of the body. The upper shadow shows the highest price traded during the period, and the lower shadow shows the lowest price. These shadows help traders see if prices moved far from the open or close, which can signal volatility or sudden changes in sentiment.

    By looking at the size and color of the body, along with the length of the shadows, traders get a quick snapshot of market mood and can spot patterns that might hint at what could happen next. For example, a candlestick with a small body and long shadows could mean traders are uncertain, while a long green body may show strong buying interest.

    Candlestick charts are popular because they make it easier to spot trends and reversals at a glance, helping traders decide when to enter or exit a trade.

    In addition to candlestick analysis, many traders use technical indicators to confirm trends and improve their decision-making.

    Common Candlestick Patterns

    Learning how to spot candlestick patterns is a valuable skill for anyone interested in trading stocks, forex, or cryptocurrencies. These patterns can help you anticipate possible changes in market direction by showing whether buyers or sellers are gaining control. Here are four widely recognized candlestick formations and what they typically signal:

    1. Bullish Engulfing Pattern

    Bullish Engulfing Pattern
    Bullish Engulfing Pattern

    This pattern appears when a large green candle follows and completely covers the previous small red candle. It often suggests buyers are stepping in after a period of selling, which could mean prices might start to rise soon. For example, if you see this on a daily chart after a steady decline, it may be worth watching for further signs of upward momentum. In ranging markets, recognizing patterns like the bullish engulfing can help traders take advantage of support and resistance levels for strategic entries and exits.

    1. Morning Star Pattern

    Morning Star Pattern
    Morning Star Pattern

    The morning star is a three-candle pattern that can point to a shift from a downtrend to an uptrend. It starts with a long red candle (showing strong selling), followed by a small-bodied candle (signaling indecision), and ends with a long green candle (showing renewed buying interest). Traders use this signal to watch for the beginning of a new upward trend.

    1. Bearish Engulfing Pattern

    Bearish Engulfing Pattern
    Bearish Engulfing Pattern

    This pattern forms when a large red candle follows and completely covers a smaller green candle. It usually appears at the end of a rally and suggests sellers may be taking over, possibly starting a downward move. For instance, spotting this at the top of a recent surge could warn you of a potential drop.

    1. Evening Star Pattern

    Evening Star Pattern
    Evening Star Pattern

    The evening star is another three-candle pattern, this time hinting at a reversal from an uptrend to a downtrend. It consists of a long green candle, a small-bodied candle, and then a long red candle. When this appears after a run-up in price, it’s often a sign to prepare for a possible decline.

    Adding Confirmation for Better Decisions

    Combining candlestick patterns with other signals—like trading volume, support and resistance levels, or technical indicators such as the RSI—can help you avoid false alarms. For example, if you spot a bullish engulfing pattern and also see rising trading volume, that increases the chance the reversal is real.

    To improve your trading accuracy, it’s useful to combine candlestick analysis with fundamental and technical analysis for a more complete view of the market.

    How to Read Price Trends on a Candlestick Chart?

    Understanding price trends is key for anyone trading or investing in financial markets. By looking at the pattern of peaks (highs) and valleys (lows) on a candlestick chart, you can get a sense of where prices might head next. If you see the highs and lows moving upward over time, that usually means buyers are in control, and the market is trending up. On the other hand, when highs and lows keep getting lower, it signals a downtrend with sellers taking charge. It’s also useful to watch for support and resistance levels, as these often influence whether a trend will continue or reverse.

    Pay attention to the shape and size of each candle. Candles with long bodies often show strong buying or selling activity—think of them as a sign that traders are confident in the current direction. In contrast, short-bodied candles suggest that buyers and sellers are unsure, and the market could be pausing before making its next move.

    Another detail to watch is the length of the shadows, or wicks, above and below each candle. A long upper wick can mean that prices tried to climb but ran into resistance, while a long lower wick points to buyers stepping in and supporting prices at lower levels. These wicks provide valuable clues about where traders are placing their bets.

    Specific candlestick formations, such as the morning star or evening star, can help confirm whether a trend is about to reverse or continue. For example, a morning star pattern often shows up at the end of a downtrend and can hint at a potential shift to an uptrend.

    One useful technique when reading candlestick charts is to combine candle analysis with technical indicators like moving averages or the ADX, which can help confirm the strength and direction of a trend.

    Comparing Candlestick Charts to Other Chart Types

    Candlestick charts stand out from line and bar charts because they show more information about price changes and market psychology. Here’s what makes them different:

    1. More Information at a Glance

    Candlestick charts display the opening, closing, high, and low prices for each time period using colored bodies and shadows (wicks). This extra detail makes it easier to see how prices moved throughout the day or hour, while line charts only plot closing prices, and bar charts are less visual.

    1. Clearer Market Sentiment

    The colors and shapes of candlesticks quickly show whether buyers or sellers are in control. For example, a long green (or white) candle suggests buyers dominated, while a red (or black) candle signals strong selling. Line charts don’t reveal this, since they focus only on closing prices.

    1. Useful for Spotting Patterns

    Many traders use candlestick patterns, such as “hammer” or “engulfing,” to spot possible trend reversals or continuations. These patterns are easy to recognize on candlestick charts, but much harder to identify on line or bar charts.

    1. Best for Short-Term Strategies

    Candlestick charts are especially helpful for short-term trading, such as day trading or swing trading. They help traders react quickly to changes and spot entry or exit points. Bar and line charts are generally better for seeing the big picture over longer periods.

    A Practical Example:

    If you’re watching the stock market for a quick trade, a candlestick chart might show a bullish engulfing pattern—where a green candle fully covers the previous red candle—suggesting a short-term rebound. A line chart would miss this detail, potentially causing you to overlook a good opportunity.

    Before relying solely on candlestick charts, it’s important for traders to have knowledge of financial markets and continuously educate themselves in order to properly interpret what these charts reveal.

    Conclusion

    Reading candlestick charts is a valuable skill for anyone interested in trading stocks, cryptocurrencies, or other assets. Each candle on the chart shows four key pieces of information: the opening price, closing price, highest price, and lowest price for a specific time period. By paying attention to these details, you can spot trends and gauge market sentiment more accurately.

    Recognizing common patterns, such as the “hammer” or “engulfing” formations, can help you anticipate possible price movements. For instance, a series of bullish candles after a downtrend might signal a shift in momentum. However, relying only on candlestick patterns can be risky. Many experienced traders combine this approach with other tools, such as volume analysis or moving averages, to confirm signals and avoid false alarms.

    Using candlestick charts as part of your routine can help you make decisions based on actual price action, rather than gut feelings. This can reduce emotional trading and improve your results over time. As trader Mark Douglas once said, “The market is never wrong in what it does; it just is.” Understanding what the candles show can help you react to what’s really happening in the market, not just what you hope will happen.

  • Advanced Trading Strategies for Consistent Results

    Advanced Trading Strategies for Consistent Results

    Learning advanced trading strategies gives you more tools to improve your results and control risk in the financial markets. Some common methods include counter trading, where traders look for points where the price may change direction, and swap trading, which takes advantage of interest rate differences between currencies. By understanding arbitrage, traders can spot and act on price differences across exchanges or markets.

    As you gain more experience, it’s helpful to add reliable day trading techniques and risk management plans to your approach. For example, using stop-loss orders and position sizing can help protect your capital during unexpected market moves. Staying updated with economic news and regularly reviewing your trades can also help you adjust to changing market conditions.

    A seasoned trader once said, “Success in trading comes not from predicting every move, but from managing risk and staying disciplined over time.” The key is to combine practical strategies with careful planning so you can aim for steady growth while keeping losses in check.

    Top Advanced Forex Trading Strategies You Should Know

    Learning advanced forex trading strategies can help you make more informed decisions and potentially improve your results. One effective method is using counter trading techniques. This approach involves going against the current trend by spotting candlestick patterns that suggest a possible reversal. For example, if you notice a hammer or engulfing pattern after a long downward move, it could signal a shift in momentum. Incorporating risk management into your counter trading is vital, as it can help protect your account from unexpected reversals.

    Another strategy is taking advantage of swap trading benefits. By keeping positions open overnight, you may earn or pay interest depending on the interest rate difference between the two currencies in your pair. For instance, if you hold a currency with a higher interest rate against one with a lower rate, you could earn what’s known as a positive swap.

    Triangulation methods offer another way to seek profit. This involves moving funds through a third currency to benefit from price differences in the bid-ask spreads. For example, if you see an opportunity to convert USD to EUR, then EUR to GBP, and finally GBP back to USD at more favorable rates, you might lock in small gains with each trade.

    Arbitrage opportunities are also worth considering, especially during times of market volatility. These occur when you find price differences for the same currency pair across different brokers or markets. By quickly buying at a lower price and selling at a higher price elsewhere, you can take advantage of short-lived discrepancies. However, this demands fast execution and awareness of transaction costs.

    Finally, applying position ratio analysis can help you read overall market sentiment. By looking at the proportion of traders who are long versus those who are short, you can get a sense of where the crowd is leaning. If most traders are long and the market starts to turn, it might be a sign to consider short positions.

    A strong understanding of leverage in forex trading is essential when applying advanced strategies, as it allows you to control larger positions with smaller capital but also increases your exposure to risk.

    These strategies can add more structure and insight to your trading approach. Always remember to test each method thoroughly and adjust your risk management according to your personal tolerance and market conditions.

    Developing a Forex Trading Strategy

    A strong Forex trading strategy can help you make better decisions and improve your chances of earning steady profits. Focusing on a few key areas can make your approach more effective and reliable. Here’s what to keep in mind:

    Understanding Market Trends

    Spotting the direction of the market is a basic step for any trader. Tools like moving averages, price action patterns, and support or resistance levels can help you recognize if a currency pair is likely to go up or down.

    For example, when the 50-day moving average crosses above the 200-day moving average, traders often see this as a sign of a longer-term upward trend.

    Combining Technical Indicators for Better Signals

    Relying on a single indicator often leads to false signals. It’s usually more effective to use several indicators together.

    For instance, you might use Bollinger Bands to check for overbought or oversold conditions and combine them with a stochastic oscillator to confirm if a trend reversal is likely. By looking at different types of indicators, you can filter out weak signals and focus on high-probability trades.

    Assessing Market Sentiment

    Understanding how other traders are positioned gives valuable insight into possible price movements. Many trading platforms share data about the ratio of long and short positions in major currency pairs.

    If most traders are betting in one direction, prices may soon move the other way as positions get closed out. Staying aware of this can help you avoid crowded trades.

    Testing Strategies with Historical Data

    Before using any strategy in real-time, it’s smart to see how it would have performed in the past. Backtesting involves running your strategy through past market data to find out if your rules would have worked.

    For example, setting up your charts in MetaTrader 4 or TradingView allows you to check the results of your approach over several years. This can help you spot weaknesses and make improvements before risking real money.

    A key part of improvement is understanding how volume analysis can help you interpret market strength and confirm the validity of your trading signals.

    Taking these steps when developing your Forex trading plan can give you a clearer perspective and increase your chances of long-term success. The more you refine your approach, the more confident and prepared you’ll feel in fast-moving markets.

    Advanced Trading Concepts

    Advanced trading strategies go beyond the basics by introducing tools and methods that help traders make more informed decisions. Quantitative analysis is a key part of this approach. By examining large sets of data, traders can spot patterns and opportunities that mightn’t be obvious through traditional methods. For example, many professional traders use statistical models to predict how a stock might react after an earnings report. In addition to these techniques, understanding your risk-to-reward ratio before entering a trade is crucial for ensuring long-term profitability.

    Understanding how market sentiment works is also important. The emotions and behaviors of other traders often drive sudden changes in price. This is why keeping an eye on sentiment indicators, such as the put/call ratio or the volatility index (VIX), can help you anticipate big moves in the market.

    Volatility trading offers another way to respond to fast-changing prices. During major news events—like central bank announcements or political developments—markets can swing sharply. Some traders use options or specialized exchange-traded funds (ETFs) to try to profit from these swings.

    Using automated trading systems is becoming more common. These systems execute trades based on pre-set rules, which helps reduce the impact of emotions on trading decisions. For example, platforms like MetaTrader or TradeStation allow users to set up automated strategies that buy or sell when certain conditions are met.

    Mastering these advanced concepts can help traders manage risk better and adjust to changing market conditions. The more you understand about data analysis, market psychology, volatility, and automation, the better prepared you’ll be to face the challenges of modern trading. One of the most essential skills is emotional control, which helps traders avoid impulsive decisions and stick to their strategies even when markets are volatile.

    If you’re looking to apply these concepts, consider exploring popular market analysis tools like TradingView for data visualization, or experiment with paper trading on platforms like Thinkorswim to test strategies before risking real money.

    Day Trading Strategies

    Day trading is all about buying and selling stocks or other assets within the same trading day. The goal is to take advantage of small price changes, often using quick decisions and a careful eye on the market. Here are some practical strategies that can help you manage your trades more effectively:

    Momentum Trading: Riding the Wave

    Momentum Trading: Riding the Wave
    Momentum Trading: Riding the Wave

    Momentum trading focuses on stocks that are moving sharply in one direction—usually upward due to news, earnings reports, or strong trading activity. For example, if a tech company announces better-than-expected profits, its stock might climb quickly.

    Traders often look for increased trading volume and price spikes as signals to enter these trades, aiming to catch the trend before it slows.

    Scalping: Quick In-and-Out Profits

    Scalping: Quick In-and-Out Profits
    Scalping: Quick In-and-Out Profits

    Scalping is a strategy that relies on making many small trades throughout the day. Instead of holding a position for hours, scalpers might buy and sell within minutes or even seconds.

    The idea is to collect small gains that can add up over time. This approach works best in markets with lots of activity and tight bid-ask spreads, such as major stocks or currency pairs.

    Using Technical Indicators to Time Entry and Exit

    Using Technical Indicators to Time Entry and Exit
    Using Technical Indicators to Time Entry and Exit

    Technical analysis tools, like moving averages and Bollinger Bands, help traders spot opportunities to buy or sell. For instance, when a stock price crosses above its 50-day moving average, it might signal an upward trend.

    Bollinger Bands can show if a stock is overbought or oversold, helping traders decide when to enter or exit a position. These tools are widely used because they help reduce guesswork.

    Market Trend Analysis: Making Informed Decisions

    Market Trend Analysis: Making Informed Decisions
    Market Trend Analysis: Making Informed Decisions

    Understanding the overall direction of the market can improve your chances of success. For example, if the S&P 500 is trending upward, it may be safer to focus on buying rather than shorting stocks.

    Tracking trends can also help you set better stop-loss orders, which protect your profits and limit your losses in case the market moves against you.

    These strategies aren’t one-size-fits-all, so it’s smart to try different methods and see what works best for your personality and risk tolerance.

    Always use a demo account to practice before risking real money, and keep up with the latest news, as market conditions can change quickly.

    Additionally, practicing with virtual demo accounts allows traders to simulate real market conditions and refine their strategies without financial risk.

    Risk Management Terms

    Managing risk is a fundamental part of trading. It helps safeguard your investment and keeps losses under control. One of the first steps is to understand your own risk tolerance. This means knowing how much money you’re comfortable risking on a single trade, so you don’t end up taking losses you can’t recover from.

    Position Sizing and Capital Allocation

    Position sizing is about deciding how much of your trading account to put into each trade. For example, many traders risk only 1-2% of their total account on any single trade to avoid large losses during a losing streak. This approach helps protect your overall capital, especially in volatile markets.

    Stop Loss Orders and Profit Targets

    Stop loss orders are tools that automatically close your trade if the price moves against you by a set amount. This helps you stick to your plan and avoid bigger losses than you intended.

    On the other hand, setting profit targets means choosing a price level where you’ll take your gains and exit the trade. Doing this helps you make consistent profits and avoid the temptation to hold onto trades for too long, which can lead to missed opportunities or bigger losses.

    Regular Strategy Reviews

    It’s important to review your trading strategies from time to time. This practice allows you to identify what’s working, spot mistakes, and adjust your plan as needed.

    For example, if you notice that your stop loss levels are too tight and you’re getting stopped out too often, you might adjust your strategy to give trades a little more room.

    By focusing on these key aspects of risk management—knowing your risk tolerance, using proper position sizing, setting stop losses and profit targets, and reviewing your strategies—you can build a more stable approach to trading.

    Utilizing stop-loss orders is a critical component of any risk management plan, as they automate trade closure and limit emotional decision-making during volatile market downturns.

    This helps you stay in the game longer and gives you a better shot at long-term success.

    Conclusion

    Managing the ups and downs of the financial markets calls for a deeper understanding of trading strategies. Techniques such as counter trading, swap trading, and arbitrage can help traders make the most of market fluctuations. For example, arbitrage involves taking advantage of price differences for the same asset across different markets, which can offer low-risk profits when executed quickly. Swap trading lets traders benefit from interest rate differences between currencies, while counter trading aims to capitalize on short-term reversals.

    Day trading is another approach that focuses on making quick trades within the same day to profit from small price movements. This method requires close attention to market trends, quick decision-making, and a firm grasp of technical analysis.

    Success in trading is not just about making the right moves—managing risk is just as important. Setting clear stop-loss levels, using position sizing, and staying updated with financial news can help protect your portfolio from sudden market changes.

  • Gold Trading Strategy: How to Trade Gold Successfully in Any Market

    Gold Trading Strategy: How to Trade Gold Successfully in Any Market

    Trading gold successfully involves more than just following price charts. Many experienced traders use technical tools like moving averages and the Relative Strength Index (RSI) to spot trends and identify entry or exit points. For example, if gold’s price stays above its 50-day moving average, some traders consider that a positive signal. At the same time, the RSI can help you avoid buying when prices are overextended.

    Global events often move gold prices. Changes in interest rates from major central banks, geopolitical tensions, or economic reports can cause sharp price swings. Staying informed about these developments helps you react quickly when the market shifts.

    Protecting your investment is just as important as spotting opportunities. Using stop-loss orders is a common way to limit potential losses if the market moves against you. It’s also wise to decide in advance how much of your account you’re willing to risk on a single trade—many traders stick to risking no more than 1-2% per trade.

    What is a Gold Trading Strategy?

    What is a Gold Trading Strategy
    What is a Gold Trading Strategy

    A gold trading strategy is a set of rules or guidelines that help traders decide when to enter, manage, and exit trades specifically for gold. These strategies can be simple or complex, depending on the trader’s experience and goals. While some traders may use the same strategies they apply to other assets, it’s important to note that gold’s higher volatility might require adjustments—especially if a strategy was designed for less volatile markets, like certain currency pairs. The best way to determine if a strategy works for gold is to test it in a risk-free demo environment, where traders can practice and refine their approach without risking real money.

    Is Trading in Gold Profitable?

    Trading in gold can be profitable, but it comes with its own set of risks. profitable gold trading strategy and gaining success largely depends on the trader’s knowledge, market conditions, and the strategies they use to manage risk and predict price movements. Gold is often viewed as a safe-haven investment, especially during times of economic uncertainty, making it a popular choice for diversifying portfolios and protecting against inflation. However, like any investment, there’s no guarantee of profit, so careful analysis and risk management are essential to succeed in gold trading.

    Which Strategy is Best for Gold Trading?

    The best gold trading strategy, especially for beginners, is range trading. This approach focuses on spotting the price range where gold tends to move, then buying when the price hits the lower end (support) and selling when it reaches the upper end (resistance). Range trading is straightforward and effective because it helps traders make decisions based on clear price levels, making it easier to manage risks and identify potential profit opportunities.

    Essential Gold Trading Strategies for Every Trader

    Making smart choices in the gold market starts with a solid understanding of a few time-tested trading strategies. Gold prices often react sharply to world events—such as central bank announcements, inflation news, or geopolitical tensions—so keeping an eye on current headlines can give you a useful edge. Understanding how inflation expectations can impact gold prices is also crucial, as rising inflation can drive more investors toward gold as a safe haven.

    Studying long-term price charts helps traders see patterns that tend to repeat, especially during certain times of the year or after major news.

    One practical strategy many traders use is the Moving Average Crossover. This approach highlights changes in the price trend, making it easier to spot when momentum is shifting. For example, if a short-term moving average crosses above a long-term one, traders often see this as a sign that prices could be heading up.

    Another helpful tool is Fibonacci Retracement. By looking at previous price movements, you can find areas where gold could find support (a price floor) or resistance (a price ceiling). These levels are useful for deciding when to enter or exit a trade, and for setting stop-loss orders to limit potential losses.

    Paying attention to the Gold-Silver Ratio can also provide clues about whether gold is overpriced or underpriced compared to silver. If this ratio moves far from its historical average, it may signal that one of the metals is due for a correction.

    Since gold prices usually move in the opposite direction of the US Dollar, tracking the US Dollar Index can help you predict possible swings in gold prices. If the dollar strengthens, gold often falls, and vice versa.

    Finally, staying disciplined is vital. Sticking to your trading plan, even when the market is volatile, prevents emotional decisions that can lead to losses.

    Key Indicators to Optimize Your Gold Trades

    Use RSI to Spot Reversals and Confirm Trends

    The Relative Strength Index (RSI) is a simple yet powerful tool for gold traders. By tracking whether the RSI value is above 70 or below 30, you can often spot when gold prices might be stretched too far in one direction.

    For example, if the RSI rises above 70, gold could be overbought and due for a pullback. On the other hand, an RSI below 30 often suggests that gold is oversold and may rebound. Traders commonly use these signals to time entries and exits more accurately.

    Understand the Impact of Moving Averages

    Moving averages, especially the 200-day moving average, help clarify the broader trend in gold prices. When the price of gold crosses above its 200-day moving average, it’s often seen as a sign that the market is shifting toward a bullish trend.

    Conversely, a drop below this line can signal weakness. Many traders wait for these crossovers before making big decisions, as they can help avoid false starts and whipsaws.

    Monitor Bollinger Bands for Volatility Breakouts

    Bollinger Bands measure the volatility of gold’s price by placing bands above and below a moving average. When the bands tighten, it usually means the market is quiet, but this calm often comes before a sharp move.

    A sudden breakout above or below the bands can indicate the beginning of a strong trend. For instance, if gold’s price breaks above the upper band on high volume, it could signal a major rally.

    Apply Commodity Channel Index (CCI) to Track Cycles

    The Commodity Channel Index (CCI) is another tool that helps traders spot cyclical highs and lows in gold. If the CCI climbs above 100, gold may be entering an overbought phase, while readings below -100 could indicate an oversold condition.

    This can be useful for swing traders looking to catch short-term changes in direction.

    Use Volume Indicators for Confirmation

    Volume indicators like On-Balance Volume (OBV) are helpful for checking if a price move is backed by real buying or selling. If gold prices rise but volume stays flat, the move may not last.

    However, if both price and volume are rising together, it’s a stronger sign the trend is genuine. Checking volume helps you filter out false signals and gives more confidence in your trades.

    Traders should also be aware of key factors influencing gold prices such as central bank activity, inflation, and geopolitical tensions, as these can impact the effectiveness of technical indicators and overall trading outcomes.

    Risk Management Techniques in Gold Trading

    Trading gold offers plenty of opportunity, but the price can move sharply in a short time. Because of this, having a solid risk management plan is one of the most important steps you can take as a trader. One practical approach is to use stop-loss orders, which let you set automatic exit points if the market turns against you. This way, you can limit your losses before they become too large.

    Pay close attention to your position size. Many experienced traders recommend risking no more than 1-2% of your account balance on any single trade. This helps protect your account if you hit a streak of losing trades and keeps you in the game for the long run. Regularly monitoring and adjusting your position sizes and strategies is crucial because gold markets, like forex, can be influenced by rapidly changing global events.

    Another key point is to look for trades where your potential profit is at least double your possible loss—a 1:2 risk-reward ratio. For example, if you’re risking $100, aim to make at least $200 on a winning trade. This approach can help your overall results even if you don’t win every trade.

    Keep a trading journal to record each trade, your reasons for entering or exiting, and the outcome. Over time, reviewing your notes can show you which strategies work best and where you might need to make changes. Gold markets can change quickly, so check your journal and adjust your plan as needed to keep up with new trends or events.

    Tips for Choosing the Right Gold Trading Strategy

    Start with Risk Management

    Building a solid risk management plan is the first step in successful gold trading. By identifying how much loss you can tolerate and what you hope to achieve, you can filter out strategies that don’t fit your needs.

    For example, if you’re comfortable with rapid decisions and short-term trades, scalping might be a good fit. On the other hand, if you prefer to hold positions over weeks or months, position trading could align better with your goals.

    Use Both Technical and Fundamental Analysis

    Relying on technical indicators like moving averages or the Relative Strength Index (RSI) can help you spot trends and decide when to enter or exit the market.

    However, it’s also wise to keep an eye on economic news, central bank decisions, and global events that impact gold prices. For example, rising inflation or political tensions often lead to higher demand for gold as a safe-haven asset.

    Practice Before You Trade Real Money

    Testing your strategy with a demo account allows you to see how your ideas perform without risking any funds.

    Many online brokers offer demo accounts that mimic real market conditions, so you can practice and make adjustments as needed.

    Stay Flexible and Review Your Approach

    Gold prices can move quickly, so it’s helpful to review your strategy regularly.

    If you notice that your method is no longer working as expected, consider adjusting your approach. For instance, you might switch from day trading to swing trading if market volatility increases.

    A key part of long-term success in gold trading is continuous learning and practice, which helps you adapt your strategy to changing market conditions and develop stronger risk management skills.

    Pros and Cons of Trading Gold

    Trading gold comes with its own set of benefits and challenges, shaped by the metal’s worldwide importance and how its price reacts to economic changes.

    Gold markets offer high liquidity, which means you can buy or sell quickly without much trouble. Many investors look at gold as a safe place to keep their money, especially during times of financial uncertainty or when stock markets are shaky. Just as with forex, selecting a reliable broker is crucial when trading gold to ensure transparent pricing and secure transactions.

    However, gold prices can change rapidly. This volatility can lead to large profits, but it also means there’s a higher risk of losing money, especially if you’re using borrowed funds to trade. Because of this, it’s important to have a clear risk management plan and to stay disciplined when making trading decisions. Calculating your risk-to-reward ratio before entering gold trades can help you manage potential losses and make more profitable decisions.

    Another key factor is that gold prices often respond to global events, such as political tensions, changes in interest rates, and economic reports. Staying updated on these factors can help you make more informed trades.

    If you trade gold through contracts for difference (CFDs) or other derivatives, keep in mind that you don’t actually own the metal. Some investors prefer to own physical gold for added security, while others like the flexibility of trading derivatives.

    If you’re considering trading gold, think about your investment goals and how much risk you’re willing to take. Compare different ways to invest, such as ETFs, futures, or physical gold, to find an approach that fits your needs.

    Gold Trading Strategy Indicators

    Gold Trading Strategy Indicators
    Gold Trading Strategy Indicators

    Indicator Common Settings / Key Levels Usage / Strategy
    Moving Averages (SMA, EMA) 50, 100, 200-period SMA; 9, 21-period EMA Trend direction; crossovers for buy/sell signals (Golden/Death Cross)
    Relative Strength Index (RSI) 14-period; RSI > 70 overbought, < 30 oversold Identify trend exhaustion and entry/exit points
    MACD (Moving Average Convergence Divergence) MACD Line, Signal Line, Histogram Crossovers for buy/sell signals; divergence analysis
    Bollinger Bands 20-period SMA; ±2 standard deviations Identify overbought/oversold; volatility squeeze signals
    Fibonacci Retracement 23.6%, 38.2%, 50%, 61.8%, 78.6% Identify support/resistance during pullbacks or rallies
    Support and Resistance Levels Previous highs/lows, round numbers Key levels for entries, exits, and stop-loss placements
    Volume-Weighted Average Price (VWAP) Daily VWAP Assess intraday bullish or bearish bias
    Fundamental Drivers DXY, Real Yields, Geopolitical Events, Fed Policies Macro factors influencing gold’s price trends

    Conclusion

    Combining technical indicators like moving averages and the Relative Strength Index (RSI) with an understanding of current economic news can improve your gold trading results. For example, if global inflation rises or central banks signal changes in interest rates, gold prices often react. Watching for these shifts alongside technical patterns helps you make better decisions.

    It’s wise to set clear risk limits for each trade. Using stop-loss orders helps protect your investments if the market moves against you. Practicing on demo accounts is a smart way to test your strategies and build confidence, as it allows you to see how your approach works without risking real money.

    As you trade, keep your methods consistent and avoid making impulsive decisions based on short-term price swings. A steady, informed plan can help you manage the ups and downs of gold trading.

  • Drawdown in Trading: Unveiling Static and Trailing Drawdown for Effective Risk Management

    Drawdown in Trading: Unveiling Static and Trailing Drawdown for Effective Risk Management

    Managing risk is a key part of successful trading, and knowing how static and trailing drawdowns work can make a real difference in protecting your account. Static drawdown sets a loss limit that stays the same no matter how your account performs. For example, if you have a $10,000 account with a $2,000 static drawdown, your account can never fall below $8,000, whether your balance goes up or not. This approach is simple and makes it clear how much you can lose from the start.

    What is Static Drawdown?

    What is Static Drawdown
    What is Static Drawdown

    A static drawdown in trading is a risk management rule that sets a fixed maximum loss limit, calculated as a percentage of the initial account balance. This means that no matter how much the account grows or fluctuates, the drawdown threshold does not change. For instance, if you start with $100,000 and have a 10% static drawdown, the most you can lose is $10,000. If your account balance drops to $90,000 at any point, you will have reached the drawdown limit—even if your account previously increased above the starting balance. This approach helps traders control risk by capping potential losses based on their starting capital.

    What is Trailing Drawdown?

    A trailing drawdown is a trading risk management mechanism that sets a maximum allowable loss limit, which increases (trails) as an account’s profits grow. Initially, the drawdown is set at a certain level below the starting account balance. As the account reaches new profit highs, the drawdown threshold moves up accordingly, but it never moves down. This means you lock in profits as your account grows, ensuring that if a significant loss occurs, you won’t lose more than the allowed trailing drawdown from your account’s peak value. This tool helps traders protect gains and control risk exposure dynamically.

    Understanding Static Drawdown

    Setting clear boundaries for potential losses is a key part of managing risk in trading, and static drawdown provides a straightforward way to do this. With static drawdown, you set a specific maximum loss for your trading account—this number doesn’t change, no matter how much your account balance increases or decreases. This approach supports consistent trading habits because it makes the stopping point obvious: if your losses hit the preset threshold, trading stops immediately.

    One main advantage of static drawdown is its transparency. You always know the exact dollar amount you can risk, which can help you stick to your plan and avoid emotional decision-making. For example, if you start with a $10,000 account and set a static drawdown limit at $1,000, you know that if your account drops to $9,000, you need to stop trading. This fixed rule removes any guesswork about when to exit. Setting a strict trading strategy for entries, management, and exits can further enhance the effectiveness of static drawdown by minimizing emotional and psychological impacts. In addition, maintaining emotional control is crucial, as it enables rational decisions and disciplined action when faced with losses or market volatility.

    However, static drawdown does have some limitations. Since the limit doesn’t increase as your account grows, you might feel restricted once you start making profits. For traders who want more flexibility as their account grows, a trailing or dynamic drawdown system might be a better fit.

    Still, static drawdown works well for those who value simple, reliable risk controls. It’s especially useful for prop firm challenges or funded trading programs, where strict rules are in place.

    Incorporating static drawdown into your risk management plan is just one of many strategies for managing risk that can help traders protect their capital and improve long-term consistency.

    Exploring Trailing Drawdown

    Trailing drawdown works differently from fixed drawdown limits. Instead of keeping your risk level the same no matter how your account grows, trailing drawdown adjusts as your balance rises. This means your risk limit moves up only when you reach new account highs. It’s a system designed to help protect your profits by tracking both closed trades and any gains from open trades. By staying aware of the exchange rate risk inherent in forex trading, you can make more informed adjustments as your trailing drawdown moves.

    One of the main advantages of trailing drawdown is that it helps you keep more of your gains during good trading periods. If your account hits a new peak, your drawdown threshold increases, which means you have a higher cushion before any restrictions are triggered. This approach helps traders avoid losing large amounts after a strong run, while still keeping discipline in place.

    For example, if your account starts at $10,000 and rises to $12,000, the trailing drawdown will follow that high. If your trading hits a rough patch after that, your risk limit is based on the new higher balance, not the original starting point. This makes it easier to protect your hard-earned profits as your performance improves.

    By adapting to your trading results, trailing drawdown encourages responsible risk management without putting a ceiling on your growth. It’s a practical tool for anyone looking to build consistency and protect gains as their trading account develops. Incorporating good risk management practices is essential to minimize significant losses and better control your trailing drawdown.

    Key Differences Between Static and Trailing Drawdown

    Static Drawdown: Fixed Risk Limit

    With static drawdown, your maximum allowed loss is set at the beginning and doesn’t move, no matter how much your account grows. For example, if you start with $10,000 and have a static drawdown limit of $1,000, you can’t lose more than $1,000 from your starting balance, even if your account increases to $20,000.

    This approach is straightforward and easy to track, but it can feel restrictive. As your account balance increases, your risk tolerance stays the same, which can make it harder to take advantage of your winning streaks.

    Trailing Drawdown: Adapting to New Highs

    Trailing drawdown, on the other hand, adjusts as your account reaches new highs. If your balance increases, the loss limit moves up too. For example, if your trading account grows from $10,000 to $15,000, a trailing drawdown will recalculate your maximum allowed loss based on the higher balance.

    This allows you to protect more of your profits and gives you more room to manage trades as your performance improves.

    Impact on Trader Psychology

    The way these drawdown methods work can affect how traders feel and act. Trailing drawdown can encourage traders to keep pushing for better results because they know their profits are being protected.

    Static drawdown, while simple, might make traders hesitant to take risks as their account grows, since the risk limit doesn’t adjust.

    Performance Tracking

    When it comes to measuring how well you’re doing, trailing drawdown offers a more flexible way to judge performance, since it adapts as you make gains. Static drawdown, by contrast, measures everything from your original starting point, which can be less informative over time.

    Summary

    The choice between static and trailing drawdown depends on your trading style and goals. If you prefer a simple, fixed rule, static drawdown might suit you.

    If you want your risk controls to grow with your account and better protect your profits, trailing drawdown is often the better fit. Either way, understanding how each method works helps you make smarter decisions in the market.

    It’s also important to remember that ignoring risk management can undermine your overall trading success, no matter which drawdown method you choose.

    Static and Trailing Drawdown Example

    Understanding how static and trailing drawdown work in actual trading can make a big difference in how you manage your account and control risk.

    With a static drawdown, let’s say you start with $100,000 and your loss limit is set at 10%. That means if your account ever drops below $90,000—even if you were previously up to $120,000—your trading privileges are stopped, and you can’t recover the account.

    This system means every trader must be careful with risk at all times, because profits don’t provide extra room for mistakes. In fact, using a structured trading plan is especially important under a static drawdown, since it helps maintain consistency and discipline regardless of account balance. Incorporating a risk-to-reward ratio can further strengthen your ability to manage losses under static drawdown conditions.

    On the other hand, a trailing drawdown moves along with your account performance. If you grow your balance to $120,000, your maximum drawdown also increases, so you might now have a limit at $108,000 (keeping the 10% rule).

    This gives you more breathing room as you earn profits, which helps you manage swings in the market without immediately risking your account.

    Both systems have their uses, and the choice depends on your trading style. Static drawdown is strict and encourages tight discipline, while trailing drawdown rewards growth by allowing more flexibility.

    Many traders working with funded accounts find that trailing drawdowns help them stay in the game longer, especially during volatile market periods.

    Each method shapes your trading approach, so pick the one that matches your risk tolerance and goals. In proprietary trading, understanding which drawdown method a firm uses is crucial for developing effective risk management strategies.

    Comparing Static and Trailing Drawdown Strategies for Your Trading Plan

    Comparing Static and Trailing Drawdown Strategies for Your Trading Plan
    Comparing Static and Trailing Drawdown Strategies for Your Trading Plan

    Choosing between a static and trailing drawdown approach starts with understanding your comfort level with risk and how you handle losses. Some traders feel more at ease with a fixed risk limit, which is what a static drawdown provides. This method gives you a clear-cut maximum loss, making it easier to stick to your rules if you don’t want your risk to change as your account grows or shrinks.

    However, if your trading style regularly leads to new account highs or you often deal with market swings, a static limit might feel too restrictive.

    On the other hand, a trailing drawdown adjusts as your account reaches new peaks, allowing you to protect gains while still giving room for account growth. This flexibility can help traders who want to lock in profits as they go, but it also means you have to accept tighter limits as your account balance increases.

    Handling these changing risk levels requires strong discipline and the ability to stay calm during both winning and losing streaks.

    To figure out which drawdown method fits you best, take a close look at your past trades and results. Ask yourself how you responded to drawdowns before and whether you prefer stability or flexibility. Different strategies suit different personalities, so there’s no one-size-fits-all answer.

    Whether you choose static or trailing drawdown, making a careful decision can help you stick to your plan and trade with greater confidence. Consistently applying effective risk management is essential to safeguard your capital and maintain long-term trading success.

    Conclusion

    Choosing between static and trailing drawdown can have a big impact on your overall trading experience and results. Static drawdown sets a fixed limit on how much you can lose, which helps you stick to your risk plan and avoid large losses. This approach is straightforward: your maximum allowable loss doesn’t change, no matter how much your account grows. It’s a solid choice for traders who want clear boundaries and a consistent risk level.